You need to use your histogram!
Posted on May 26, 2020 • 7 minute read
Many beginner photographers simply don’t use their camera’s histogram at all, while many others don’t use it enough, but it’s a real oversight.
For many photographers, particularly those early in the early stages of learning, it’s easy to get caught up in taking an exposure that looks good rather than an exposure that is good. Thankfully, that’s where the histogram comes in, and it really is a powerful tool that shouldn’t be overlooked.
In issue 77 of Photography News, as part of our Summer Festival, we took an in-depth look at mirrorless cameras. Among the many things they offer, many photographers find the live stream of information taken from the sensor to be one of the best – information like histogram data, for example.
Though some DSLRs do feature a Live Mode offering similar results, it’s typically reserved for more high-end models. One of the joys of virtually any mirrorless camera, however, is the ability to shoot using a live histogram, rather than taking a test shot, viewing it to check the data, then adjusting accordingly. In some instances, this can be the difference between nailing your exposure in one and missing the shot entirely.
But why would you need to use the histogram if your camera is equipped with Live View? Well, in many instances, the LCD or viewfinder alone can be deceptive. If there’s too much light on your screen or you’re in a very low-light environment, they may appear especially dark or bright. The same thing happens if your LCD brightness isn’t adjusted appropriately. Even in ideal conditions, your eyes will never be as accurate as cold, hard data.
How to use a camera’s histogram
If you’re going to use your camera’s histogram, first you’ll need a firm understanding of what exactly you’re looking at. Thankfully, it’s really very simple.
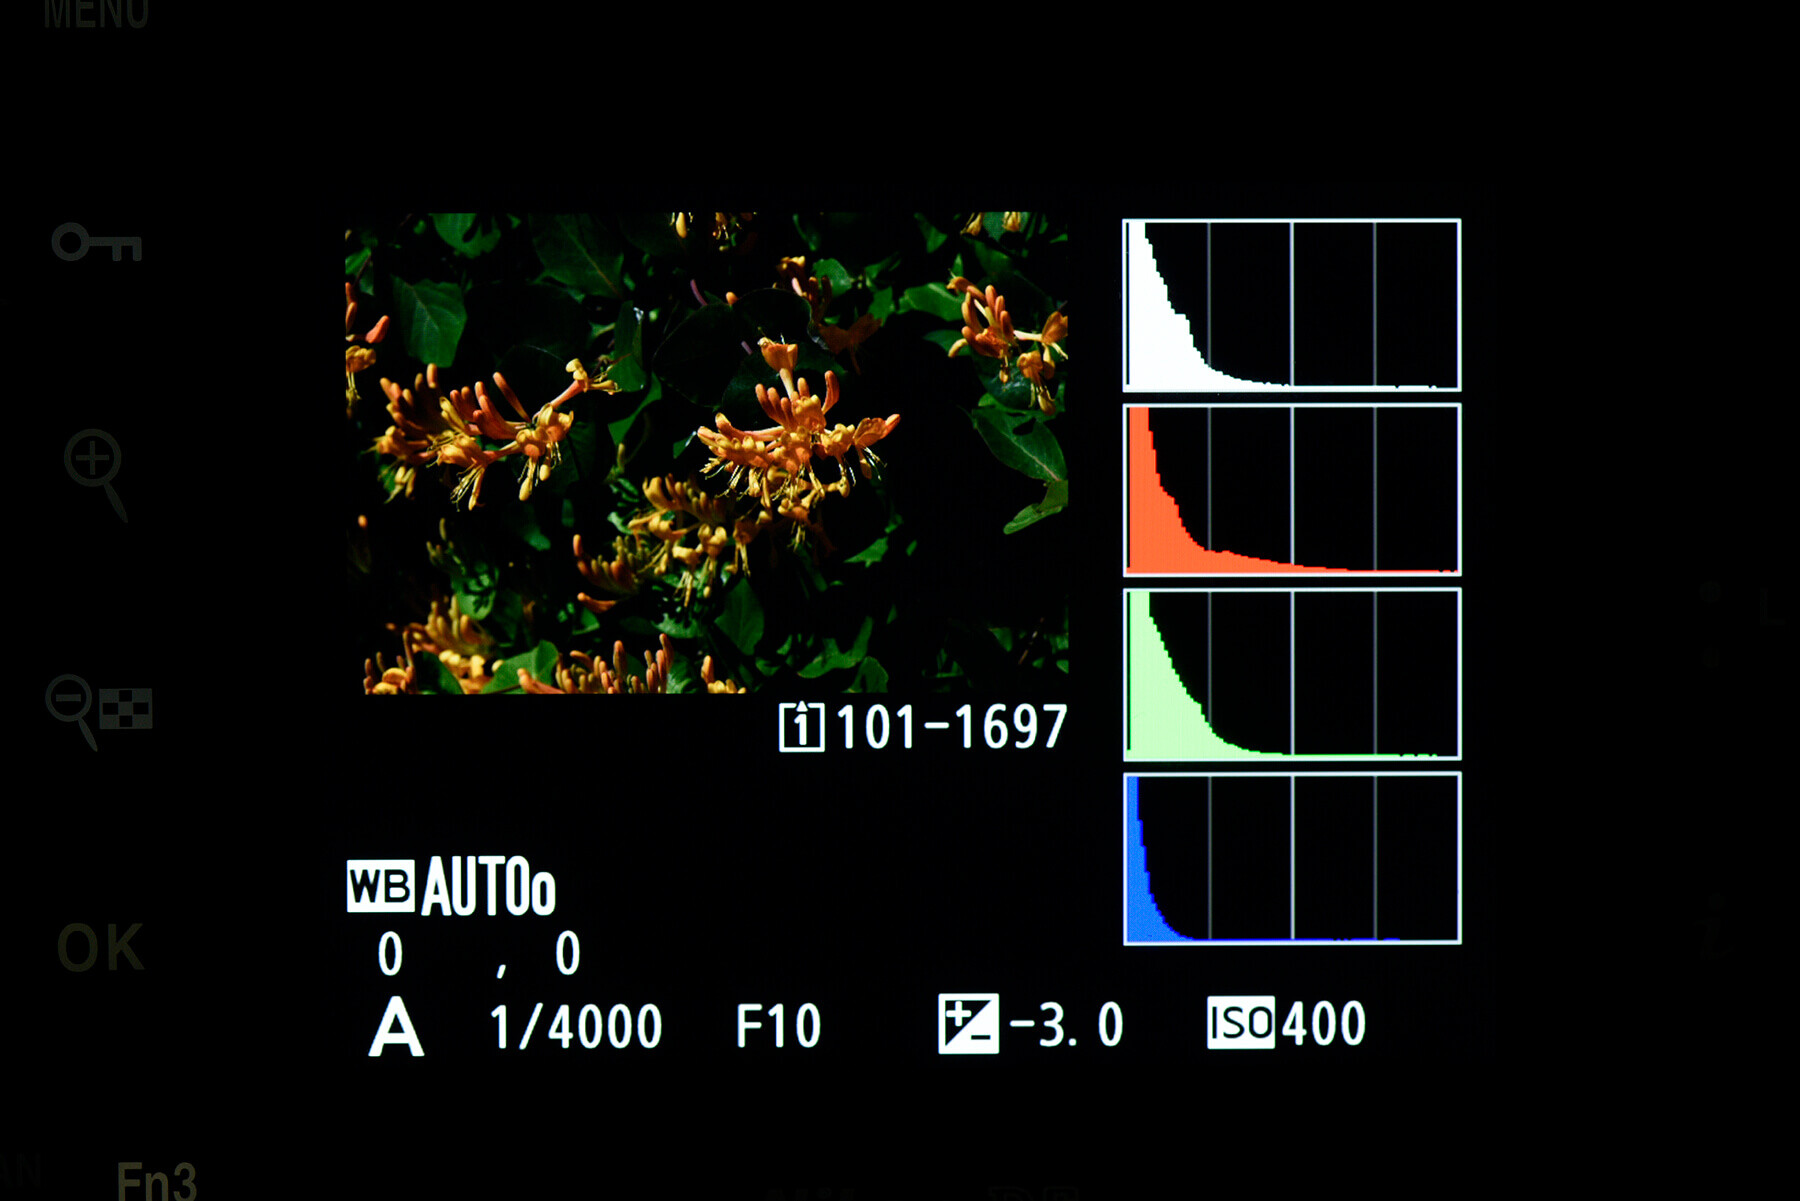
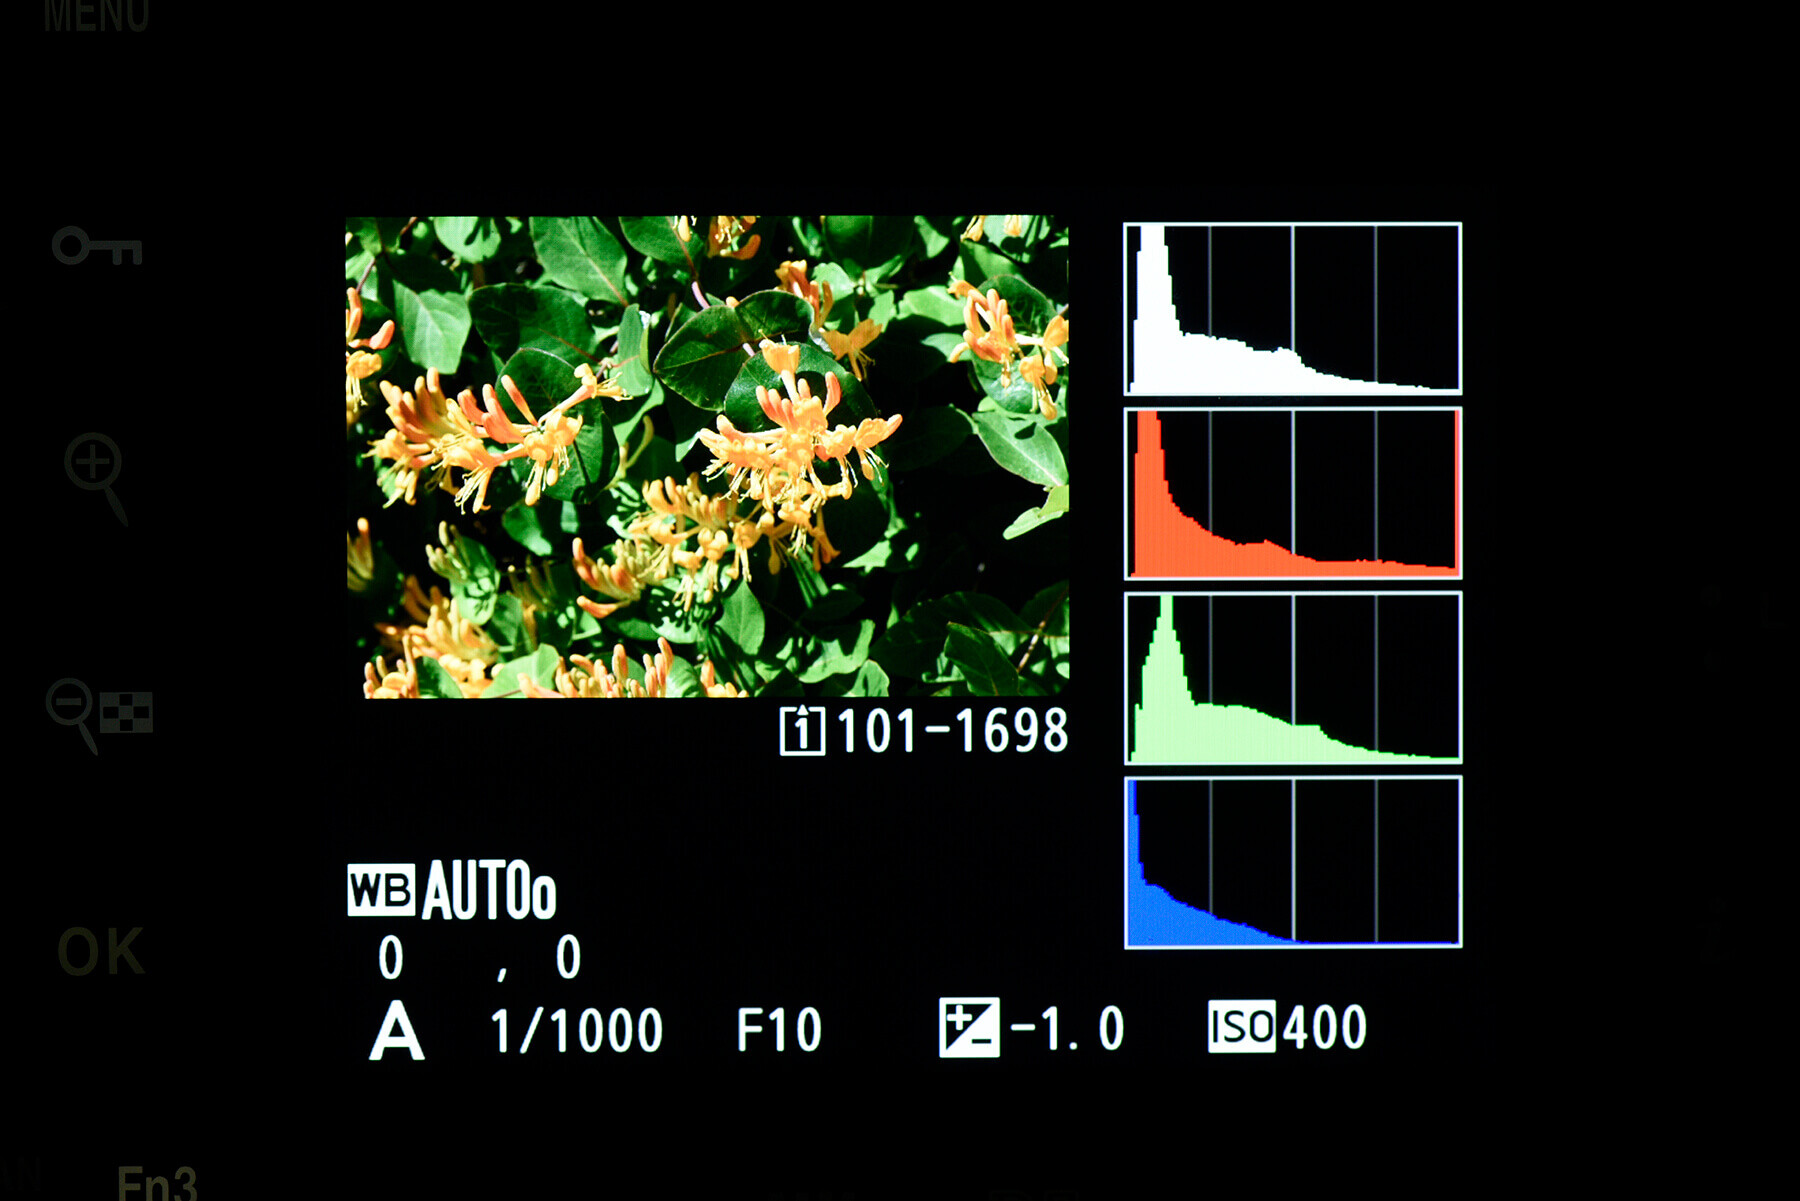
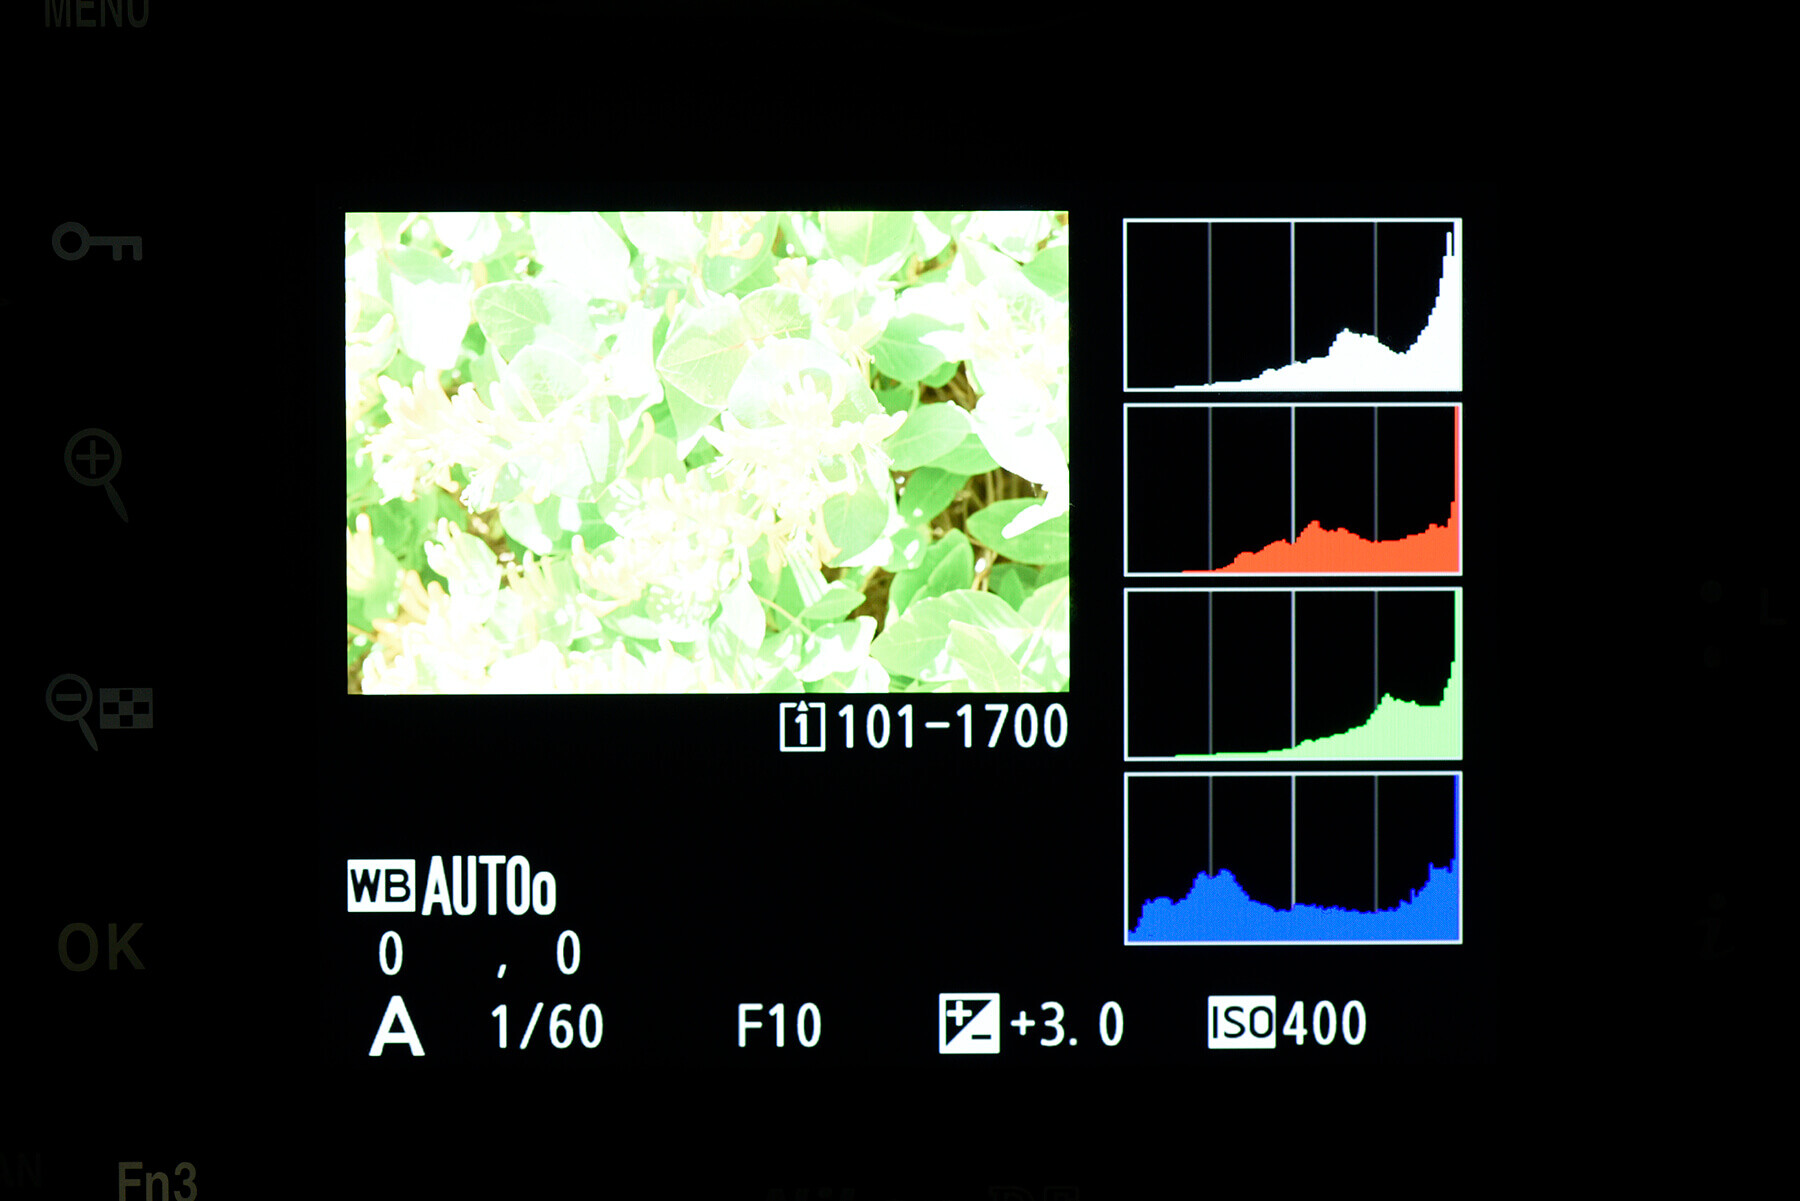
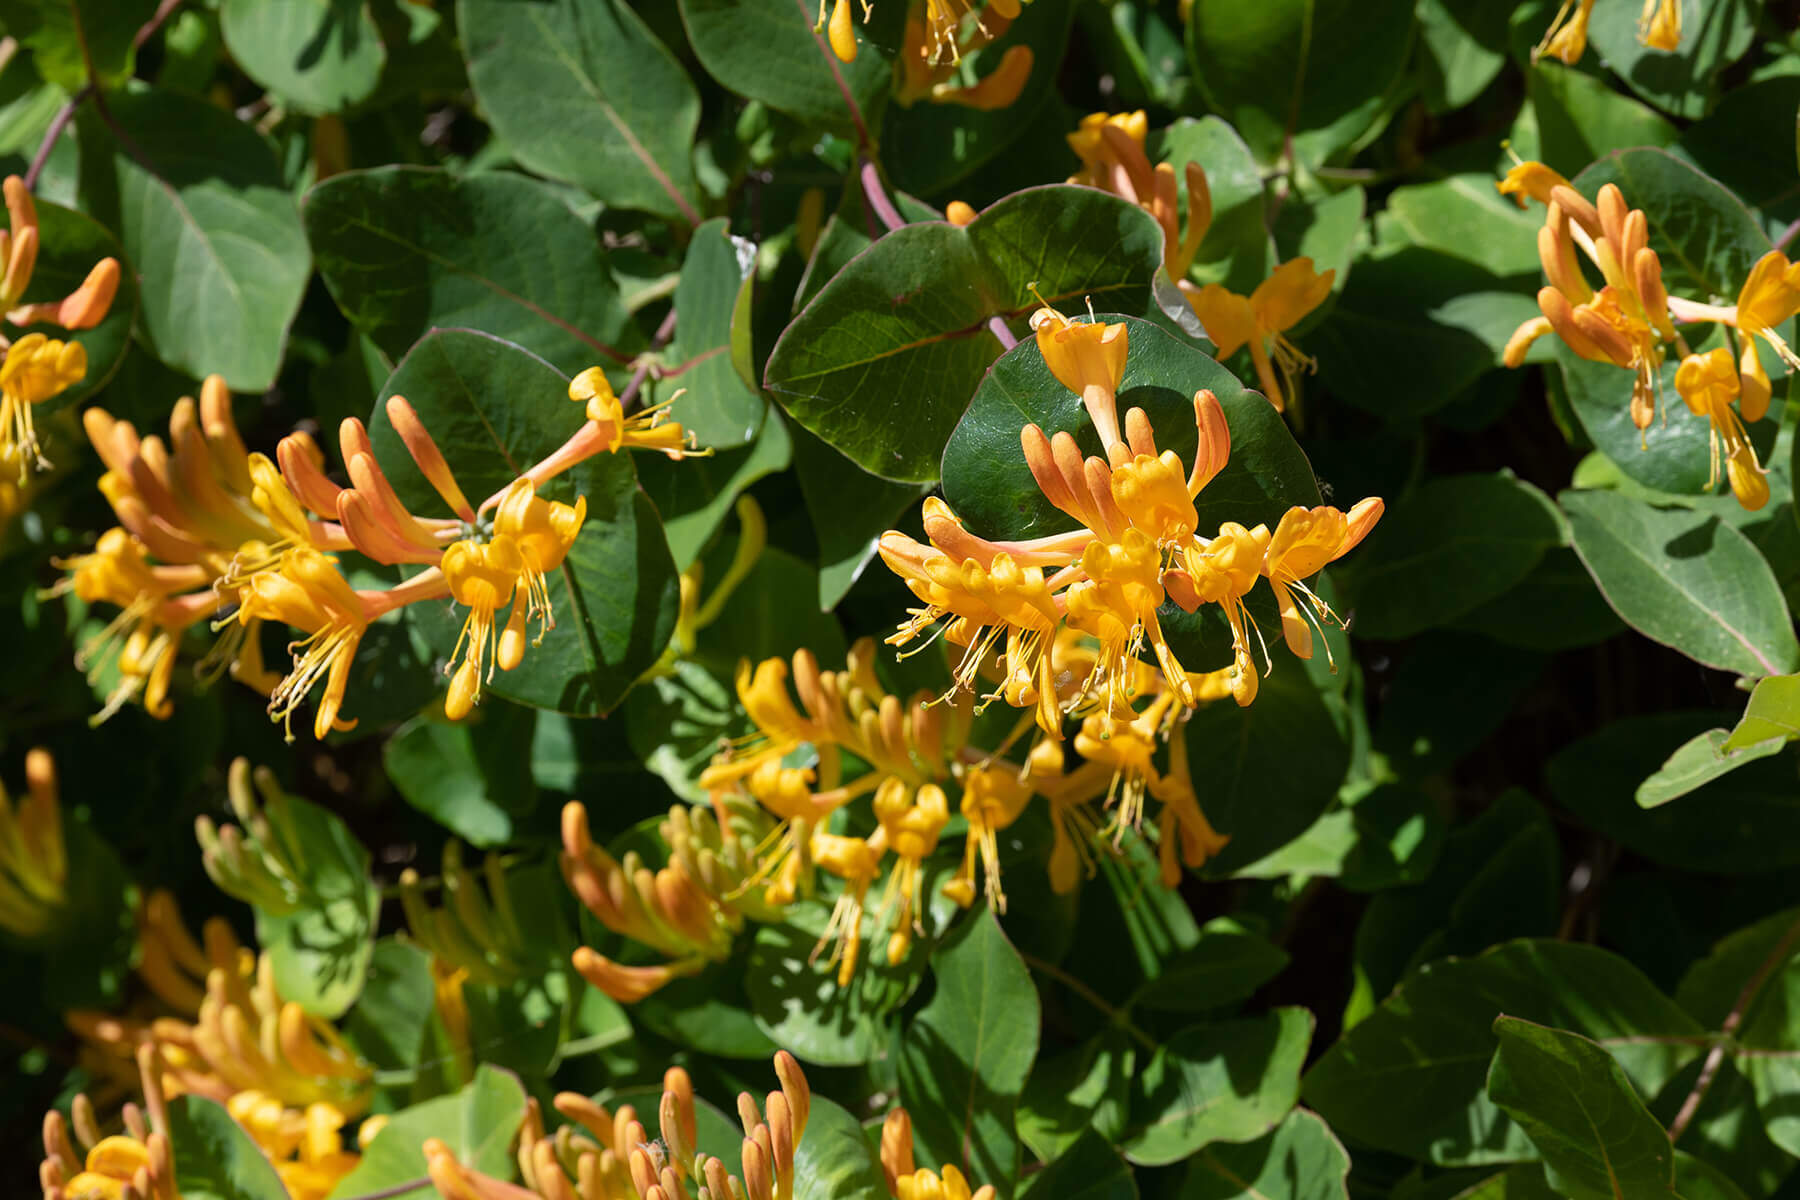
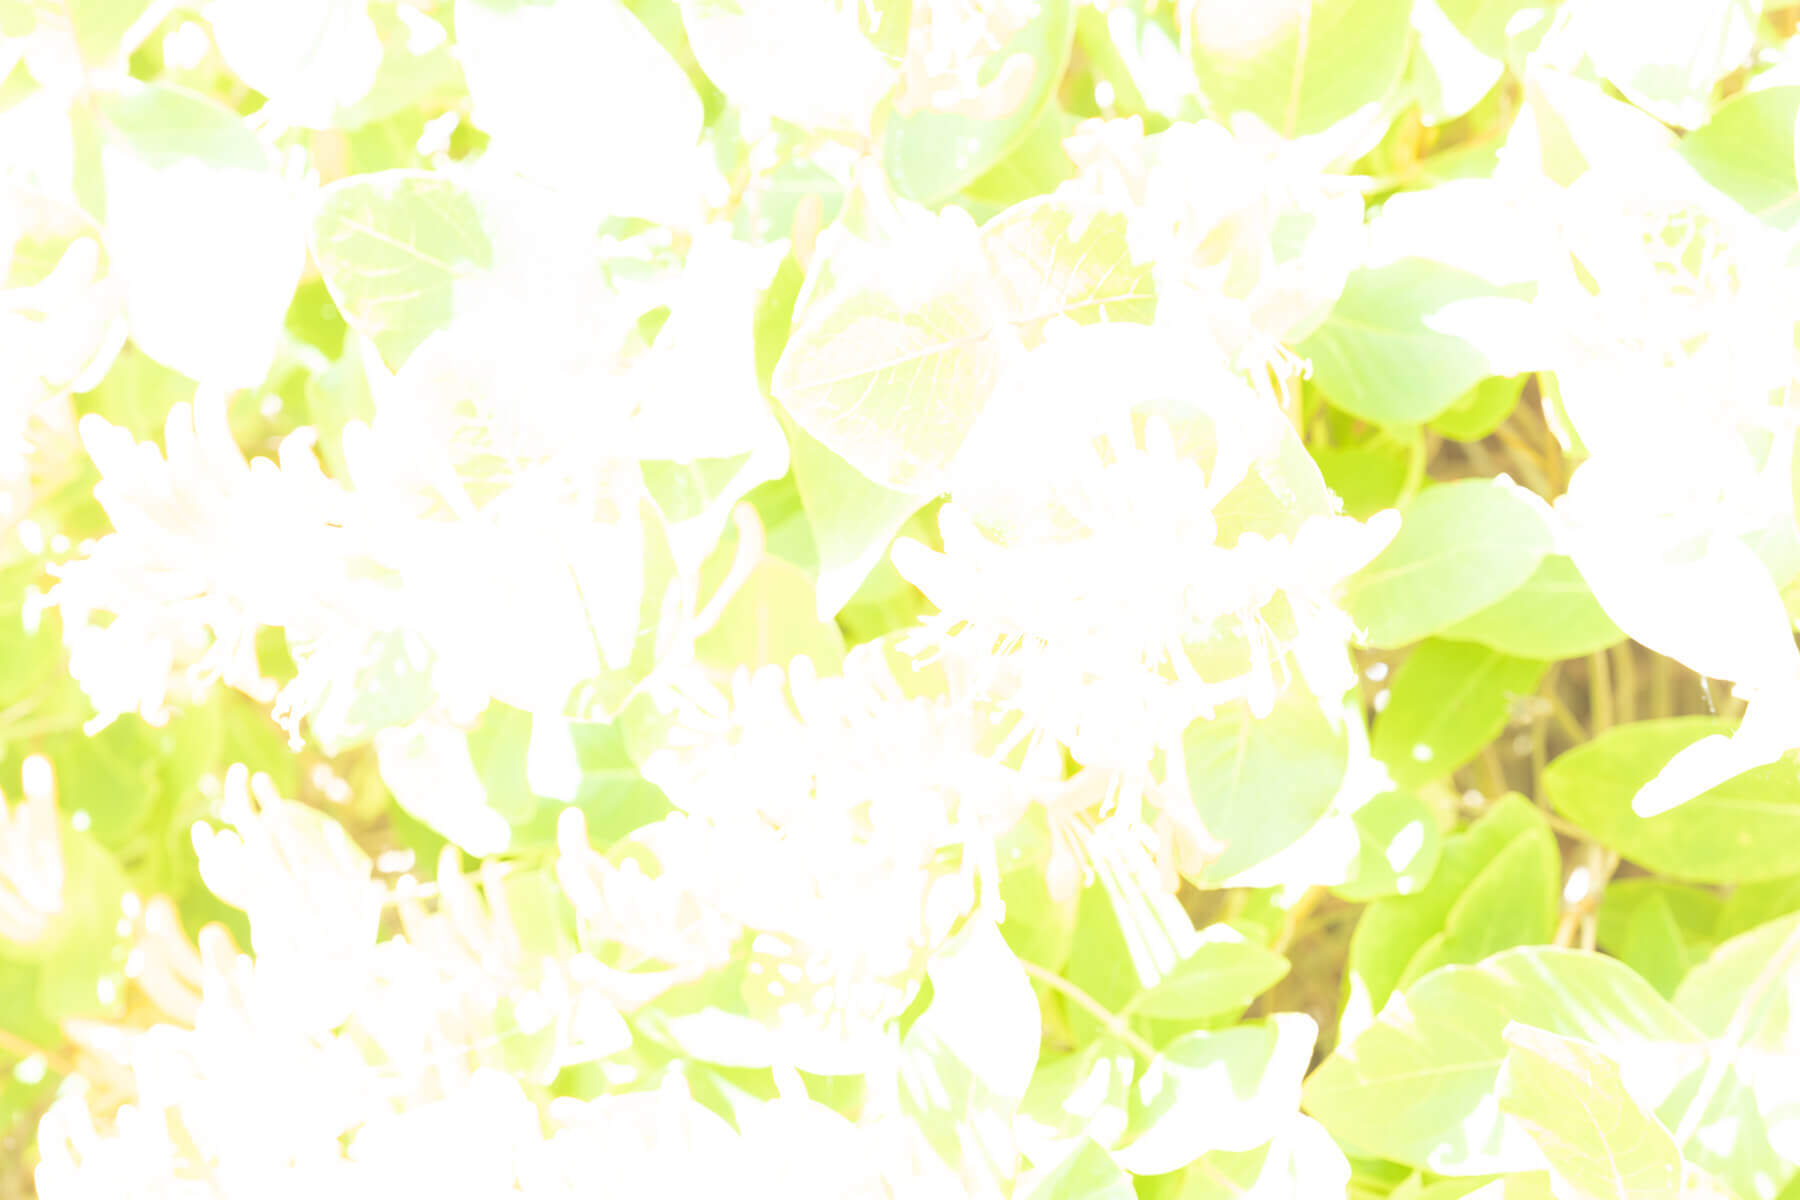
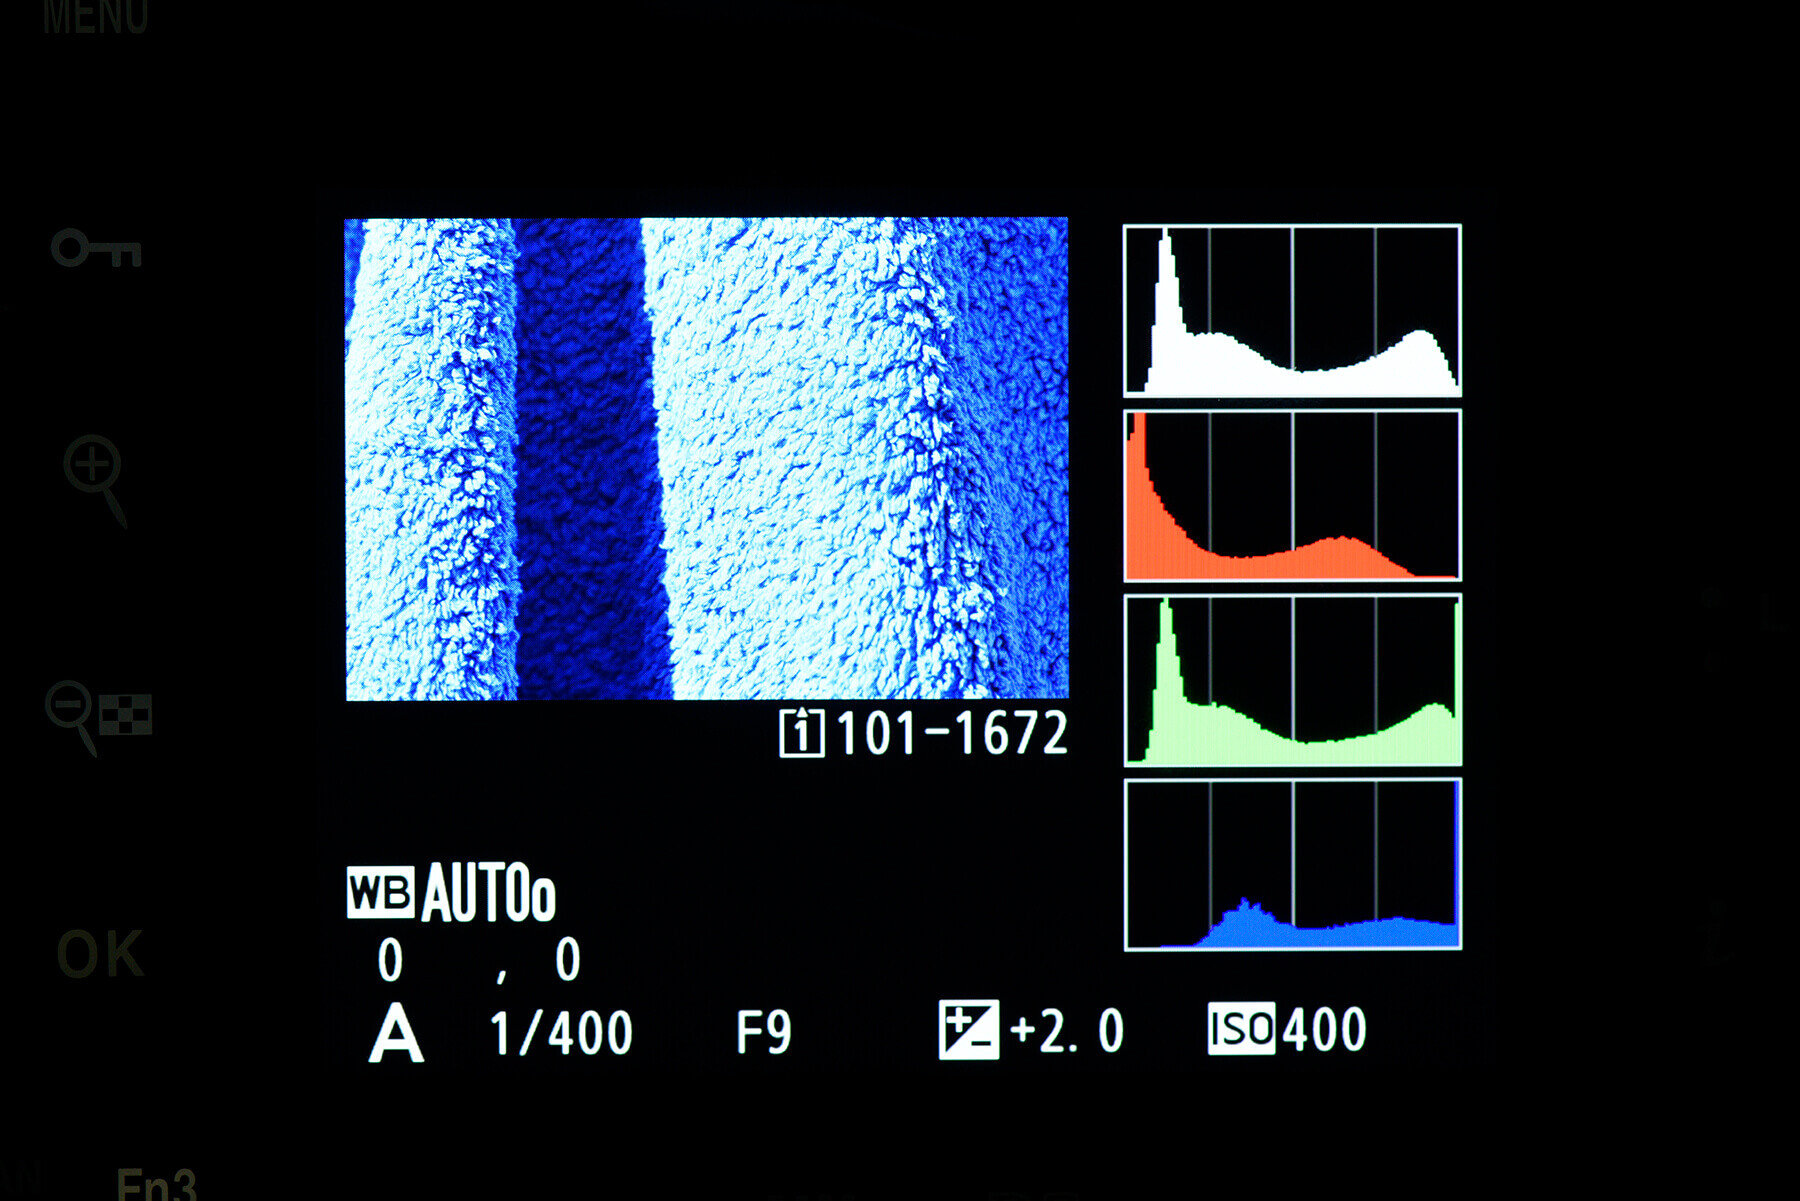
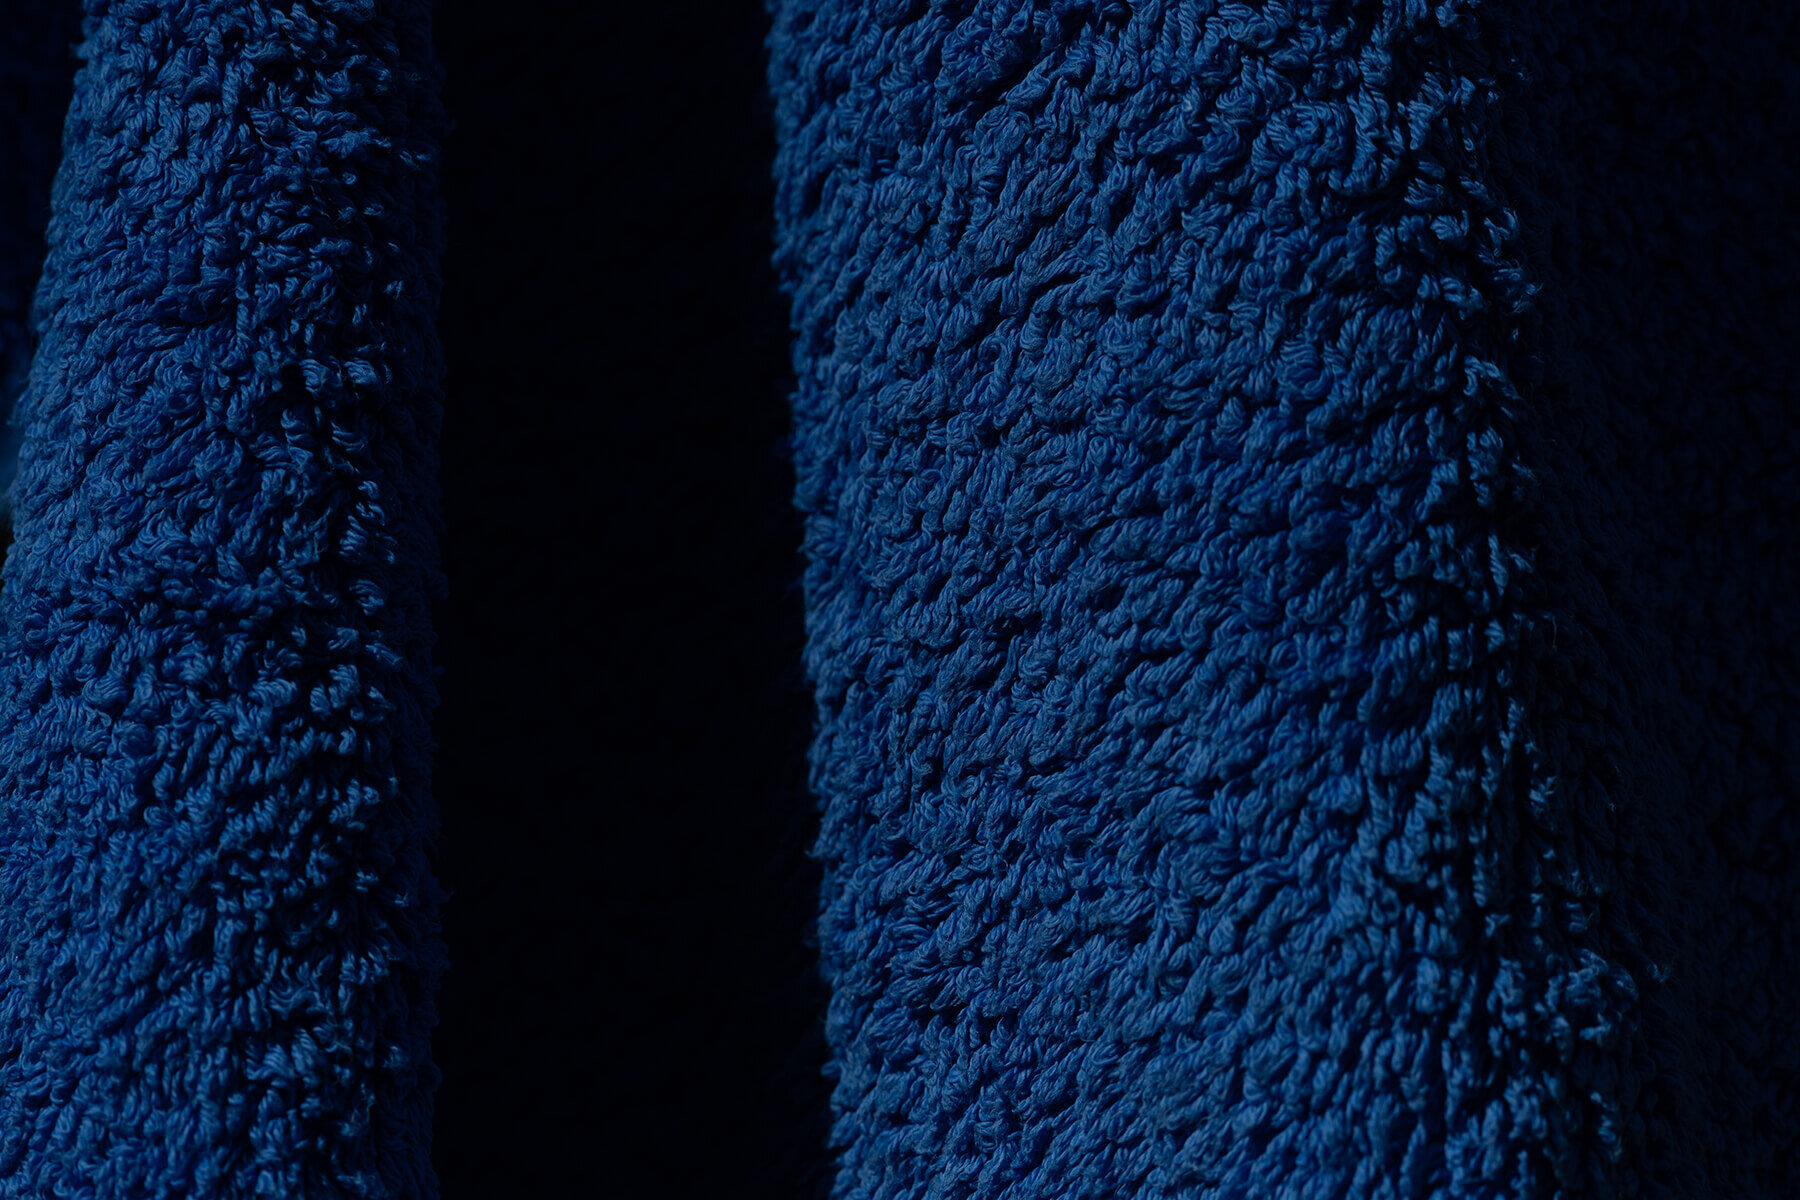
In the most basic terms, a histogram shows the amount of light present in a scene across the range, moving from black, to shadows, to midtones, to highlights and finally white, going from left to right on the graph. The height of the peaks shows the amount of data present in each area. For example, in a bright scene, you’ll see the majority of the data shift to the right, and the highest peaks will likely be seen there, too.
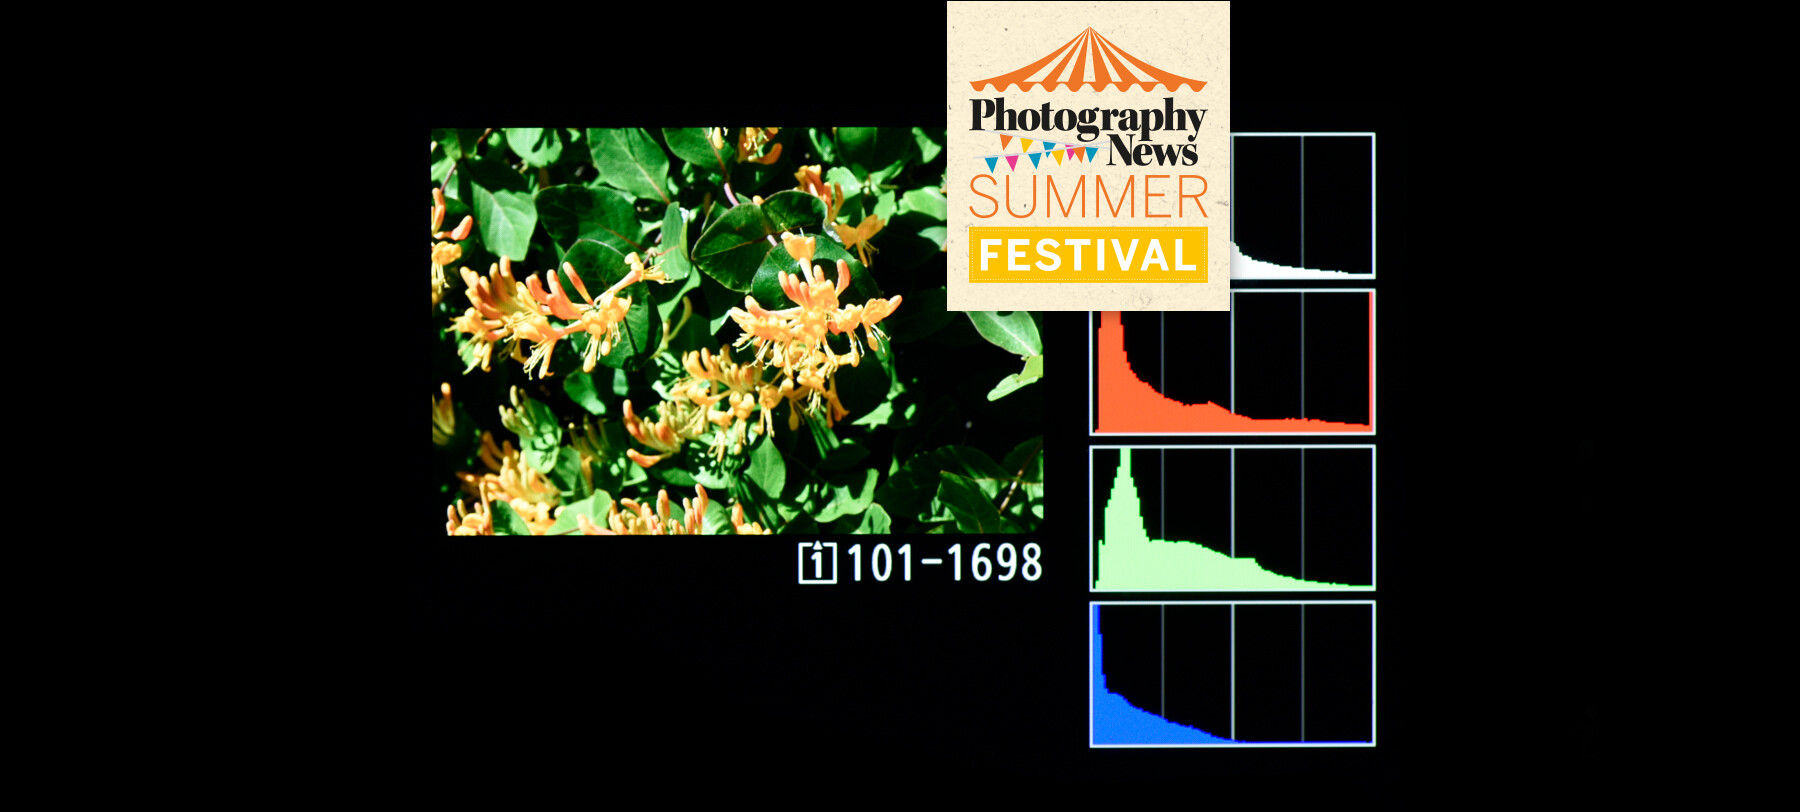
It’s well-advised to avoid ‘clipping’ where possible. This is where your exposure is balanced so that the data reaches one edge or the other, meaning you’ve hit complete black or complete white in the darkest or brightest areas of your frame. In these cases, data is lost and cannot be recovered in editing if needed.
Click the images to see a larger view
It’s important to note that if you’re capturing Raw files, you’ll have additional leeway. The histogram that appears on your camera is very likely that of the JPEG, and what may be unrecoverable there may be well within the Raw file’s normal range.
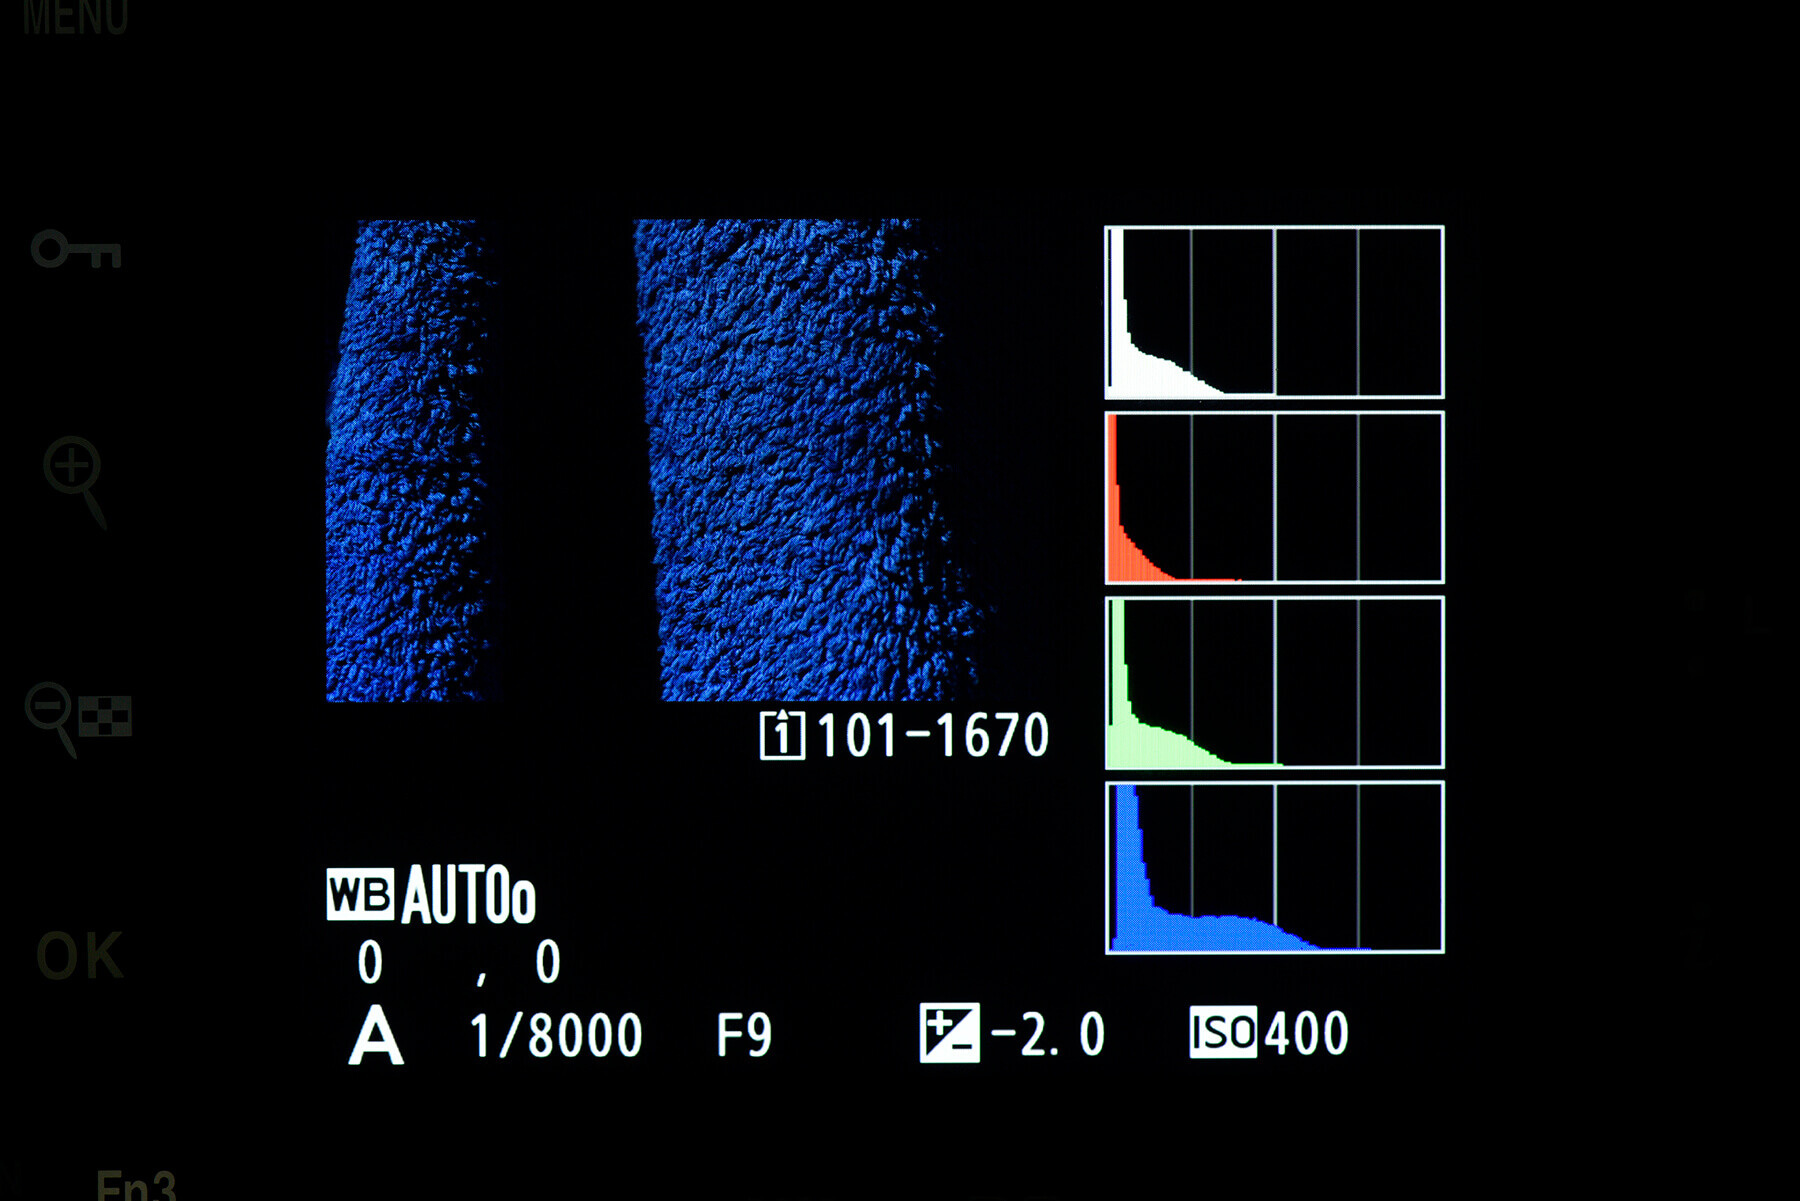
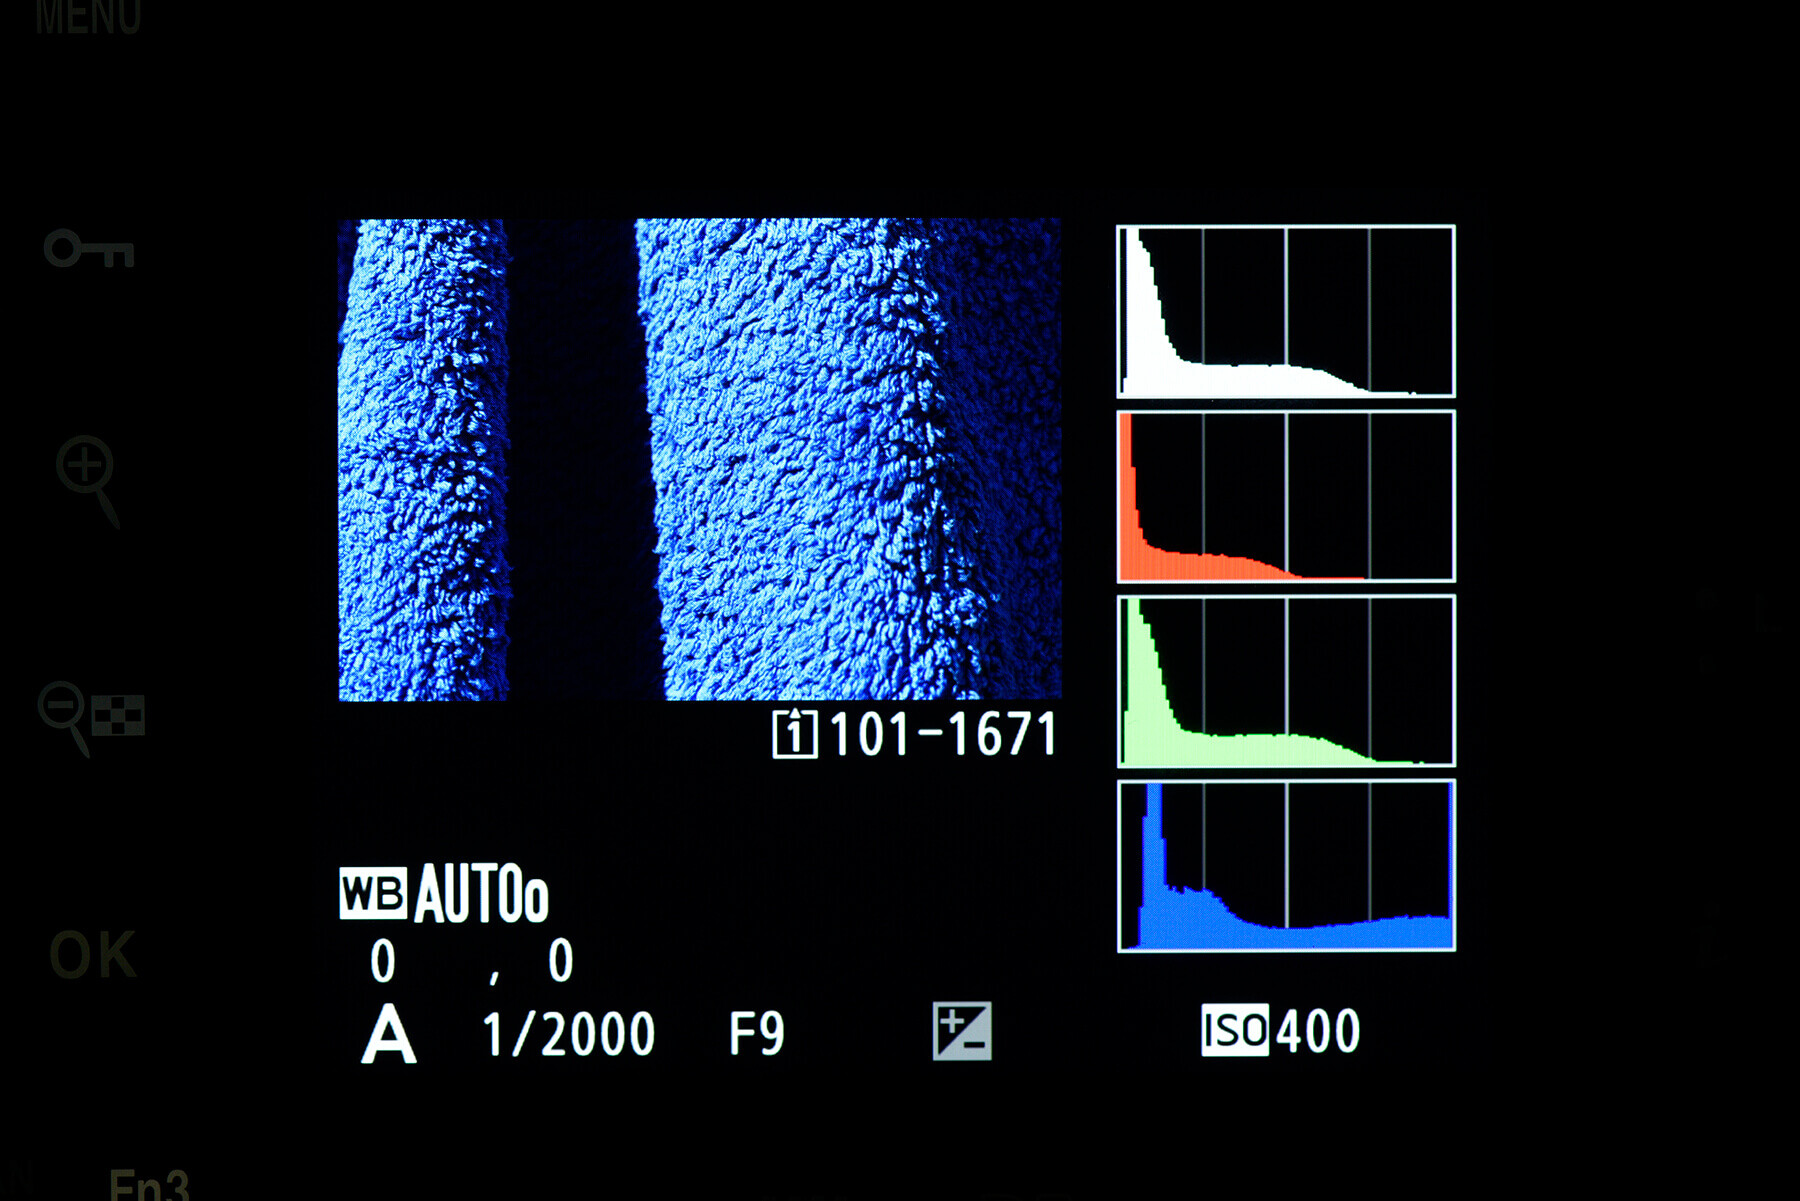
Your camera may also feature an RGB histogram as well as the simpler luminance histogram outlined above. Where the luminance graph shows an average of all RGB channels combined, the RGB histogram shows data from the individual colour channels.
The data reads the same, but the three graphs will vary depending on how much of each colour is present in your scene. Some photographers prefer the greater detail, as it can prevent blown out colours in specific areas. An RGB histogram can show clipping on a certain channel, where a luminance histogram may not have due to the average being brought down by the other two channels.
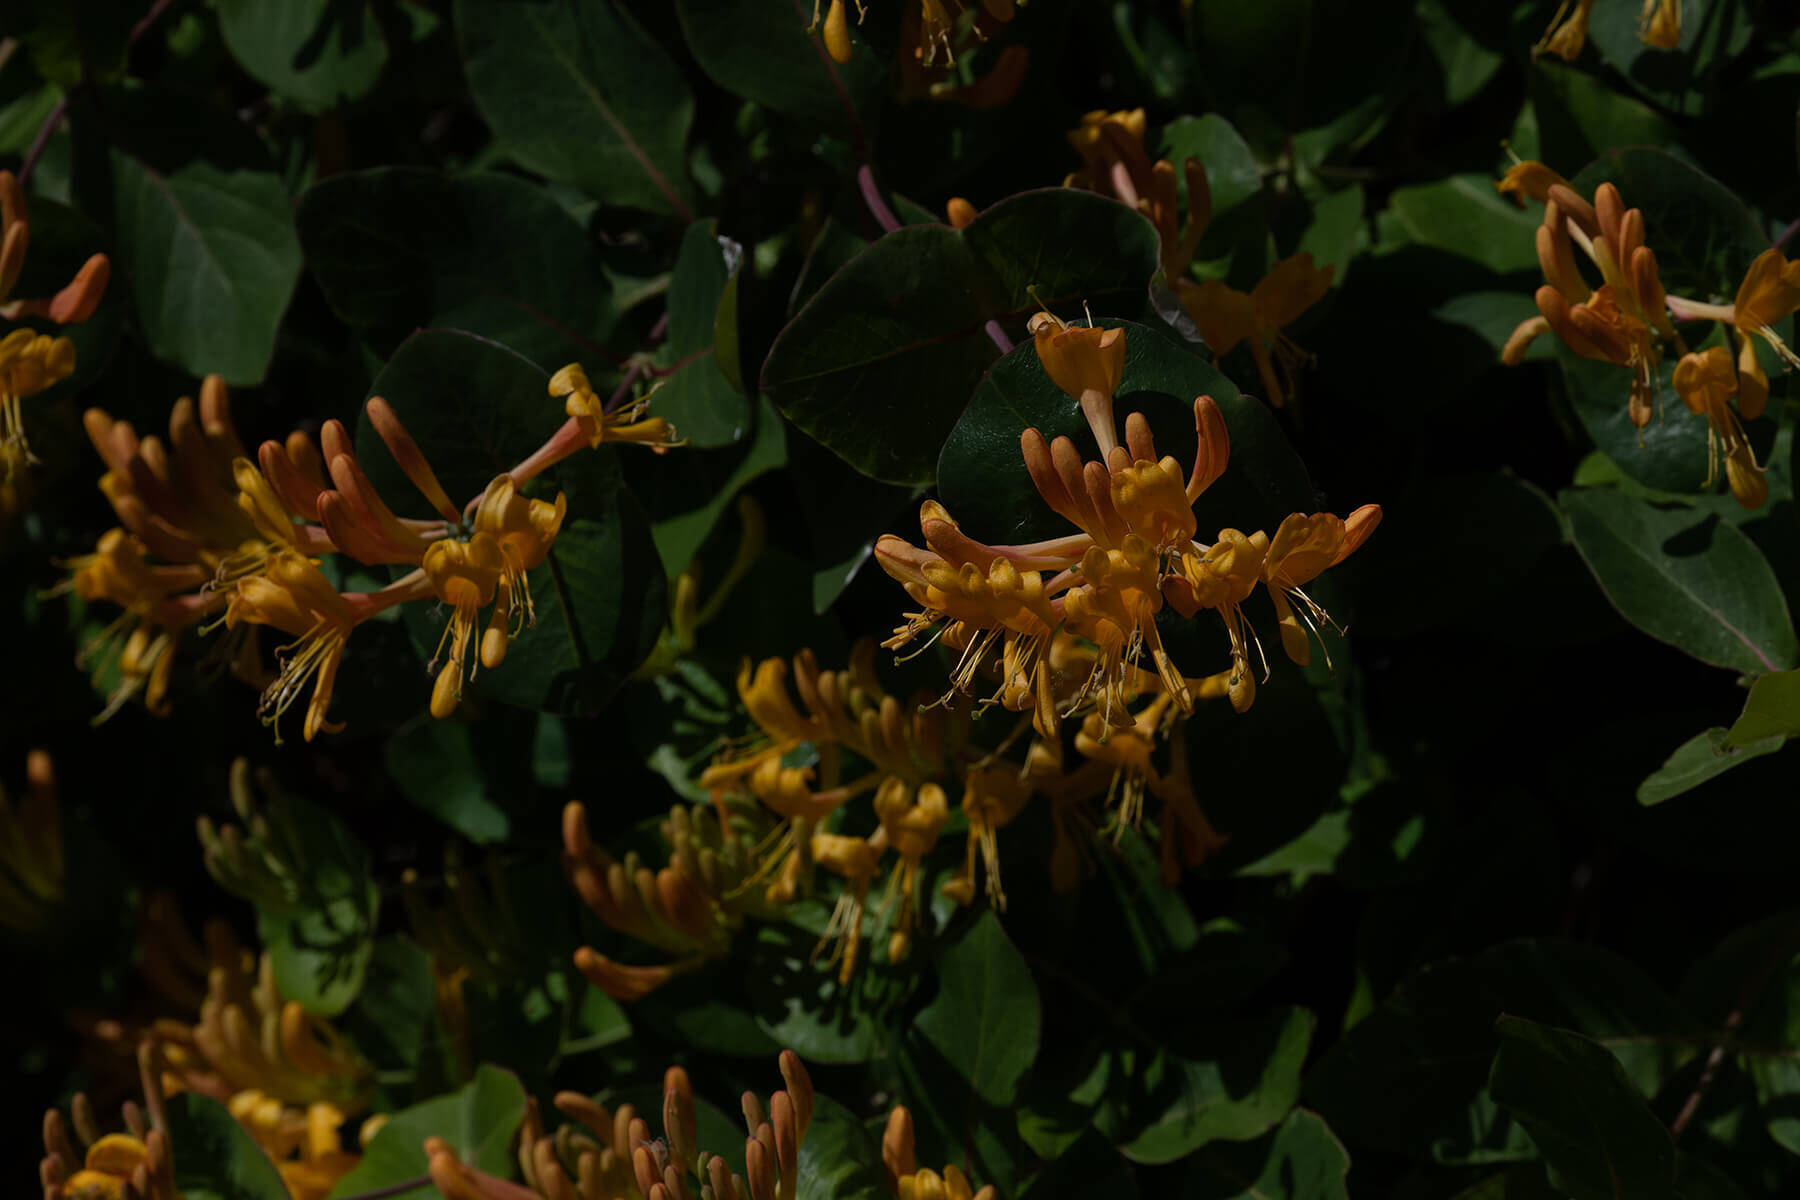
Click the images to see a larger view
Histogram myths
The old adage states a correctly balanced exposure will show a smooth, mountain-like histogram. By meeting this standard, you can ensure you have a pleasing range of tones with good contrast, but realistically, this isn’t attainable in many cases.
There are countless things that go into making a photo great, and this is just one of them. You shouldn’t let a tool such as the histogram overrule your intention.
With certain scenes and photos, capturing irretrievably dark data might not matter, for example. If the intention is to capture a very dark image, there’s no chance you’d want that data back in any case, so the loss is no real loss at all.
Earlier, when we talked about using the histogram to avoid taking an exposure that looks good rather than an exposure that is good, what we didn’t mention is that ‘good’ is a relative term. It can only be determined by you in the moment of each and every shot.
Regardless of if you’re using it to get an accurately balanced exposure, or to ensure over- or underexposing exactly as you intend, the histogram can be extremely valuable. By using it as you shoot rather than leaving it as an afterthought, you may just get better results than ever.
Over the next few months, you can enjoy more content from the Photography News Summer Festival. In print, we’ll have in-depth guides, interviews and more, starting with issue 77, free to read online now.
We’ll also have three online features per week across the photo kit, camera technique and video technique categories. There may even be bonus content appearing on The Photography News Podcast in future episodes!
So, stick around for an exciting summer and be sure to shoot along with us! You can always share your photos with us on social media by tagging @photonewspn. You can even enter our #PNpicme reader image competition.
Don’t forget to sign up to receive our newsletter below, and get notified about the new issue, exclusive offers and competitions.
Have you heard The Photography News Podcast? Tune in for news, techniques, advice and much more! Click here to listen for free.

